Ever wonder what the common denominator is for all successful law firms? They’re making the best use of marketing metrics.
In marketing, there are two sides to the coin. The first side is the planning and implementation of a marketing strategy. The other side is tracking and measuring the success of these marketing efforts. The latter is just as important as the actual marketing plan. To track and measure success (or lack of), you’ll need the help of marketing analytics. According to The Blueprint, “marketing analytics is a data-driven discipline that focuses on quantifying the effectiveness of marketing campaigns and informing marketing-related business decisions.”
Before we dive into the technicalities of law firm marketing analytics, let’s quickly evaluate if you truly need to track and understand marketing metrics:
[frontend-checklist name=” track marketing metrics”]
If you have checked at least one of the boxes, chances are you’ll most probably benefit from a marketing strategy that revolves around keeping specific metrics in check and optimizing your campaigns around them!
Some of the many benefits you can expect from interpreting your marketing metrics include:
- Understanding which channels provide the highest ROI.
- Making the best business and marketing decisions.
- Allocating money towards the channels that work best for your firm (i.e. that generate the most money for your firm).
- Measuring the progress of campaigns, e.g., PPC advertisements.
The importance of the metrics will depend on what your business is targeting across the campaigns. However, the end goal is to generate quality leads that’ll turn into conversions, AKA – calls and cases.
While tracking numbers, analyzing all the data, and measuring results can seem daunting, it doesn’t have to be. We have previously created the ultimate legal marketing budget planning cheat sheet with the top 5 tips and tricks when starting to budget your marketing dollars.
Now, we want to dive deeper into the next step: interpreting the top legal marketing metrics. Here we’ll discuss the measurable legal metrics, what they are, why they matter, how to track them, and extra checklists (Psst…at the bottom, we provide a FREE marketing metrics checklist!)
Now that we’ve crossed the first bridge, let’s move on to the next:
The Top Legal Marketing Metrics:

Law firms that are investing in marketing are investing dollars and time. Nonetheless, far too many firms spend thousands of dollars on marketing activities every month without having clear goals or a definitive idea of what success looks like for their firm. This is absolutely preventable, and we’d like to help your firm learn how to maneuver the marketing world with the best in legal marketing. We want to help you answer the question: how much of the pie is my firm taking?
It’s essential to gather the critical marketing metrics you want/need to track to have a baseline to start with and grow. Don’t know where to start? That’s okay; we’ve got you covered!
According to a study conducted by MIT and Google, 89% of leading marketers use strategic metrics like gross revenue, market share, or CLV (customer lifetime value) to measure their campaign’s effectiveness.
In addition, it’s critical to pair these other relevant metrics that are part of the sales funnel. Specifically, the sales funnel comes into play here because it gives you an understanding of your customer’s buying process and behaviors across the purchase journey. This is especially relevant for firms with a digital marketing presence because it can help define and optimize the entire customer journey to convert more prospects into customers eventually. Below we’ll explain the entirety of each part of the sales funnel and relevant metrics:
TOFU (Top of the Funnel) Metrics: Awareness Stage.
At the awareness stage of the sales funnel, your prospects are not necessarily ready to buy. More so, they’re at the stage of learning and recognizing they have a problem and seek further information. Although the goal here is not to convert clients straight away, measuring TOFU with metrics can help you understand what content interests prospects the most/least, boosting your brand awareness and reach.
Relevant KPIs at the awareness stage include:
- Reach: how many people saw your posts?
- Engagement: How many people liked/commented/shared’ your posts?
- Average time on site: The user’s average duration on the web page.
- Unique page views: How many users visited a specific page.
- Bounce rate: The percentage of people who viewed one page on your website and left.
The KPIs mentioned above can be found on the tracking tool your firm’s website uses. For example, Google Analytics is one of the most popular user behavior tools to gather this type of information.
MOFU (Middle of the Funnel) Metrics: Consideration Stage.
Your prospects are interested in a firm’s services at the middle of the funnel, but they aren’t set on one firm. At this point, your prospects know they have a problem and seek solutions. Here, they’ll need further convincing because they are comparing and contrasting your firm with others.
MOFU is a critical point where firms can nurture and propel those leads into action. The prospects you nurture here can quickly turn to customers. Here, you’ll notice the difference between leads that are quality leads versus those that aren’t. Your firm must showcase its reliability and be the best problem-solver because clients looking for firms with high-stakes and legal issues are most likely willing to bet on the best. So, how can you show your points of difference? For starters, include quality content such as:
- Case studies.
- Research reports.
- Service comparisons.
- Solution briefs.
- Email marketing.
Relevant KPIs at the consideration stage include:
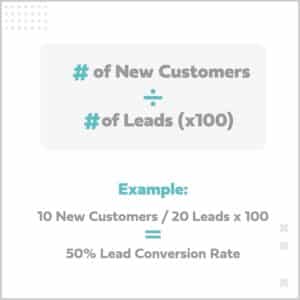
- Lead conversion rate: The number of leads compared to the total number of visitors. This is the formula:
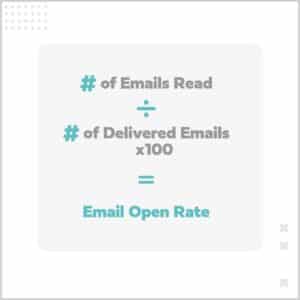
- Email open rates: If you are investing time and energy into newsletters or other forms of email marketing, it’s key to measure the open rate. This will give you an idea of the client’s level of interest and measure how your campaign is received. You can calculate it like this: For example, if you send out 10 emails, 2 of them bounce, then the number of delivered emails is 8. Out of those 8 emails, 4 are opened. Your open rate is 8/4 = 0.5. If you multiply 0.5 x 100 = 50% open rate.
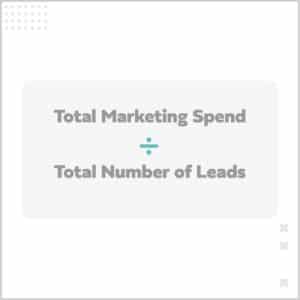
- Cost per lead: This is the investment required to acquire new leads. For example, if you paid $1,000 on Facebook Ads and you acquired 20 leads, that means your cost per lead is $50.
- Number of MQLs turning to SQLs: If you want to get more specific about leads it’s possible to divide leads into two: MQLs and SQLs. The marketing qualified lead, MQL, turns into a sales qualified lead, SQL when the prospect has been identified as one likely to go through with the service. The way to measure the effectiveness of the conversion is by comparing the SQLs to the closed deal.
BOFU (Bottom of the Funnel) Metrics: Conversion Stage.
This is the stage where prospects convert into clients…in other words, this is where you earn a sale! At the bottom of the funnel, you can find some of the most important metrics because they show impact through revenue.
Optimizing and ensuring your BOFU strategy is on-point is key because prospects on this level of the sales funnel are on the verge of converting to your customers. The low-hanging fruit can be yours to take if you take the time to provide content relevant to this audience and measure the success of such efforts. For starters, content that’s relevant to this audience includes:
- Other customer testimonials/ social proof.
- Competitive analysis.
- Service reviews.
- Demos.
- Webinars.
- Workshops.
In addition to the content, the following KPIs can help you understand what it takes to convert leads into customers:
1. Customer acquisition cost (CAC): CAC is the total sales and marketing cost required to earn a new customer over a specific period of time. Many use the CAC because it compares the number of money firms spends on attracting new customers versus the number of customers gained. First, you’ll need to determine the period you’re evaluating, e.g., the quarter? The semester? The year?

Then you can add the total marketing costs and the total sales costs for that specific time and divide it by the number of customers acquired.
2. Marketing Return on Investment (MROI): The reason it’s marketing ROI and not just ROI is to measure the return on investment from the amount a firm spends on marketing – it’s known as MROI. While it may look simple, there are some complexities to this formula. For example, calculating the total “cost on a marketing investment” can be confusing. However, it’s recommended to include everything from the start of creative development, media spending, all the way to the customer service.
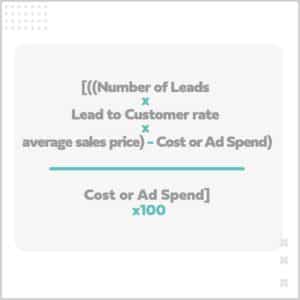
Hubspot recommends the following formula and criteria when calculating the MROI:
- The number of leads: how many converted to a lead?
- Lead-to-customer-rate: What percentage of leads are customers? If 10 out of 100 leads became customers, your lead-to-customer rate is 0.1 or 10%
- Average sales price: The average price of your service.
- Cost or ad spend: How much money did you spend on creating and promoting the marketing campaign?
Overall, the goal is to end with a positive percentage and, ideally, a higher number if possible.
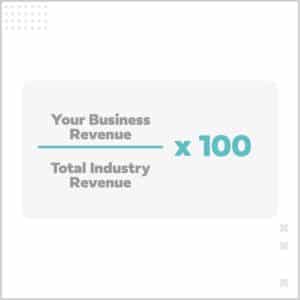
3. Market Share: This refers to the percentage of the industry’s sales that you own. This is important for law firms, especially those in niche yet competitive markets such as personal injury, family law, and criminal law. On the other hand, marketers use this to know how your company ranks against competitors and later develop new marketing strategies to reach more prospects.
You can think of it like this: If there were a total of 100 auto accident cases in your area in the last month and you took care of 70 of them, 25 from competitor A and 5 from competitor B that means you own 70% of the market. You’re the leading industry competitor for that month. It’s typically calculated for a specific period and separated by regions. This is the formula:
How Much of the Pie Are You Taking?

As firms continue to invest in marketing to grow their calls and cases intake, it’s critical to check your firm’s health through relevant KPIs.
Measuring the right KPIs is important when you invest time and money in digital marketing efforts such as PPC, SEO, content creation, social media marketing, etc.
Because clients today do not take a linear customer journey, measuring, tweaking, and improving your marketing strategies as you grow is essential. Now that we’ve mentioned relevant KPIs linked to the various stages of your customer’s journey, here’s how you can motivate your staff to work towards your goals:
[frontend-checklist name=”work towards goals”]
Business today is challenging because of the fiercely competitive environment offline and online. Nevertheless, your firm can go a long way with clear direction and dedication. If you have any questions about planning, selecting, measuring, or just about anything related to marketing, we’re here to help!